The Analytics Dashboard provides administrators with real-time insights into subscription performance, recurring revenue, renewals, churn, and customer activity. It consolidates key subscription metrics into a single interface, enabling store owners to monitor business health and identify trends over a selected reporting period.
Navigate to:
WordPress Dashboard → Flexi Subscription → Analytics
Date Filter #
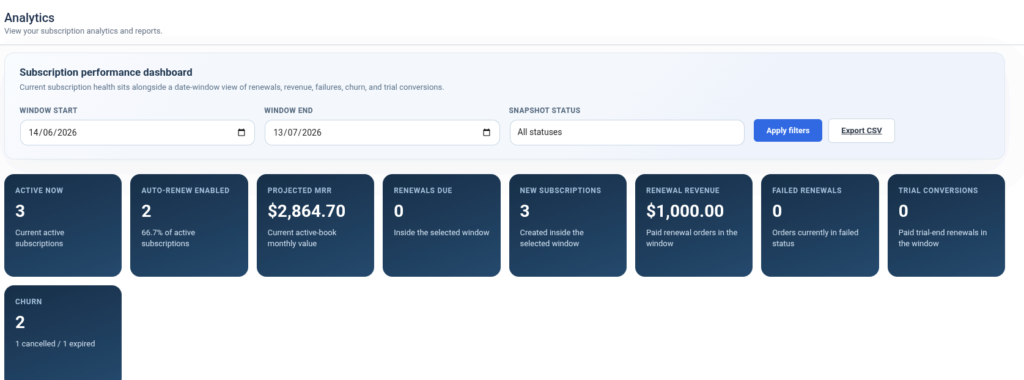
The dashboard begins with a reporting filter that allows administrators to generate analytics for a specific time period.
Available filters include:
- Window Start Date
- Window End Date
- Snapshot Status
- Apply Filters
- Export CSV
The selected date range updates all dashboard statistics and reports.
Subscription Performance Summary #
The top section displays key performance indicators (KPIs) for the selected reporting period.
Available metrics include:
| Metric | Description |
|---|---|
| Active Now | Number of currently active subscriptions. |
| Auto-Renew Enabled | Active subscriptions with automatic renewal enabled. |
| Projected MRR | Estimated Monthly Recurring Revenue from active subscriptions. |
| Renewals Due | Number of renewals scheduled within the selected period. |
| New Subscriptions | Total subscriptions created during the selected period. |
| Renewal Revenue | Revenue generated from successful renewal orders. |
| Failed Renewals | Renewal payments that failed during the reporting period. |
| Trial Conversions | Trial subscriptions successfully converted into paid subscriptions. |
| Churn | Total cancelled and expired subscriptions. |
These summary cards provide a quick overview of subscription performance.
Current Status Mix #
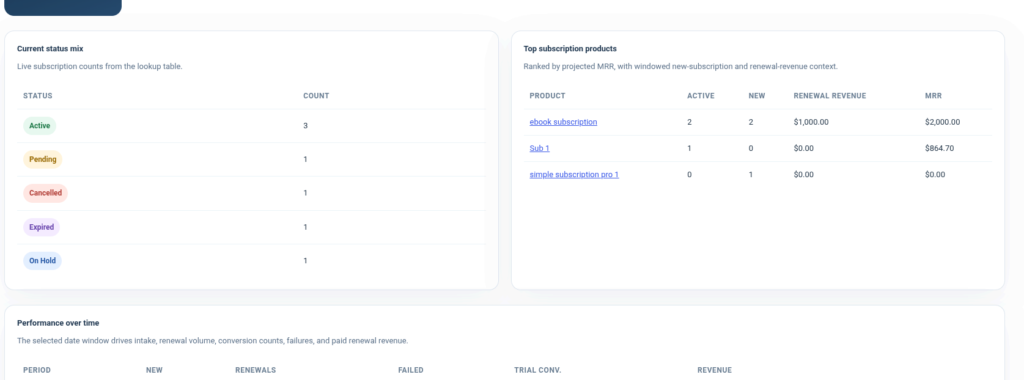
The Current Status Mix table summarizes subscriptions by their current status.
Displayed statuses include:
- Active
- Pending
- Cancelled
- Expired
- On Hold
Each status displays the total number of subscriptions currently in that state, helping administrators understand the overall health of the subscription base.
Top Subscription Products #
The Top Subscription Products section ranks subscription products based on recurring revenue.
For each product, the dashboard displays:
- Product Name
- Active Subscriptions
- New Subscriptions
- Renewal Revenue
- Monthly Recurring Revenue (MRR)
This report helps identify the highest-performing subscription products.
Performance Over Time #
The Performance Over Time table provides daily subscription activity within the selected reporting window.
Each row represents a reporting period (typically one day) and includes:
- Period
- New Subscriptions
- Renewals
- Failed Renewals
- Trial Conversions
- Revenue
This report enables administrators to monitor subscription activity and revenue trends over time.
Current Subscription Snapshot #
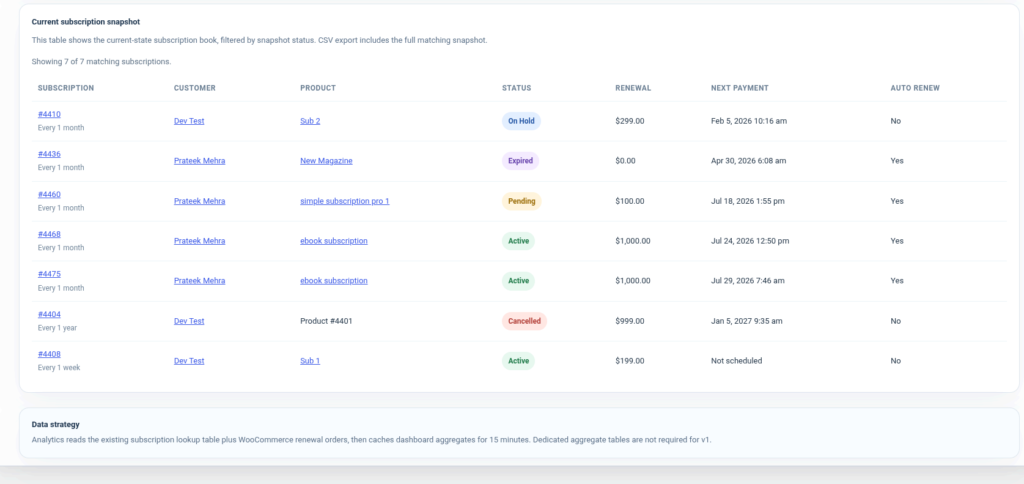
The Current Subscription Snapshot displays the current state of all subscriptions matching the selected filters.
The table includes:
| Column | Description |
|---|---|
| Subscription | Subscription ID and billing interval. |
| Customer | Customer associated with the subscription. |
| Product | Subscription product. |
| Status | Current subscription status. |
| Renewal | Renewal amount. |
| Next Payment | Scheduled next payment date. |
| Auto Renew | Indicates whether automatic renewal is enabled. |
The snapshot provides a complete overview of the current subscription book.
CSV Export #
Administrators can export analytics data using the Export CSV button.
The exported report contains subscription information matching the selected filters, making it suitable for external analysis, reporting, or record keeping.
Dashboard Features #
The Analytics Dashboard enables administrators to:
- Filter reports by date range and subscription status.
- Monitor recurring revenue performance.
- Track subscription growth over time.
- View active and inactive subscription counts.
- Analyze churn and failed renewals.
- Measure renewal revenue.
- Identify top-performing subscription products.
- Review subscription status distribution.
- Monitor daily subscription activity.
- Export analytics reports in CSV format.